Moving with Food Allergies: Best & Worst Places in the U.S. (2025)
Great Guys Moving presents its Best and Worst places in the U.S. for Allergy-Friendly Living in 2025, evaluating the nation's states and top cities based on key factors essential for families managing food allergies.
Jump to Key Findings >>
- Key Findings
- Compare Results by City
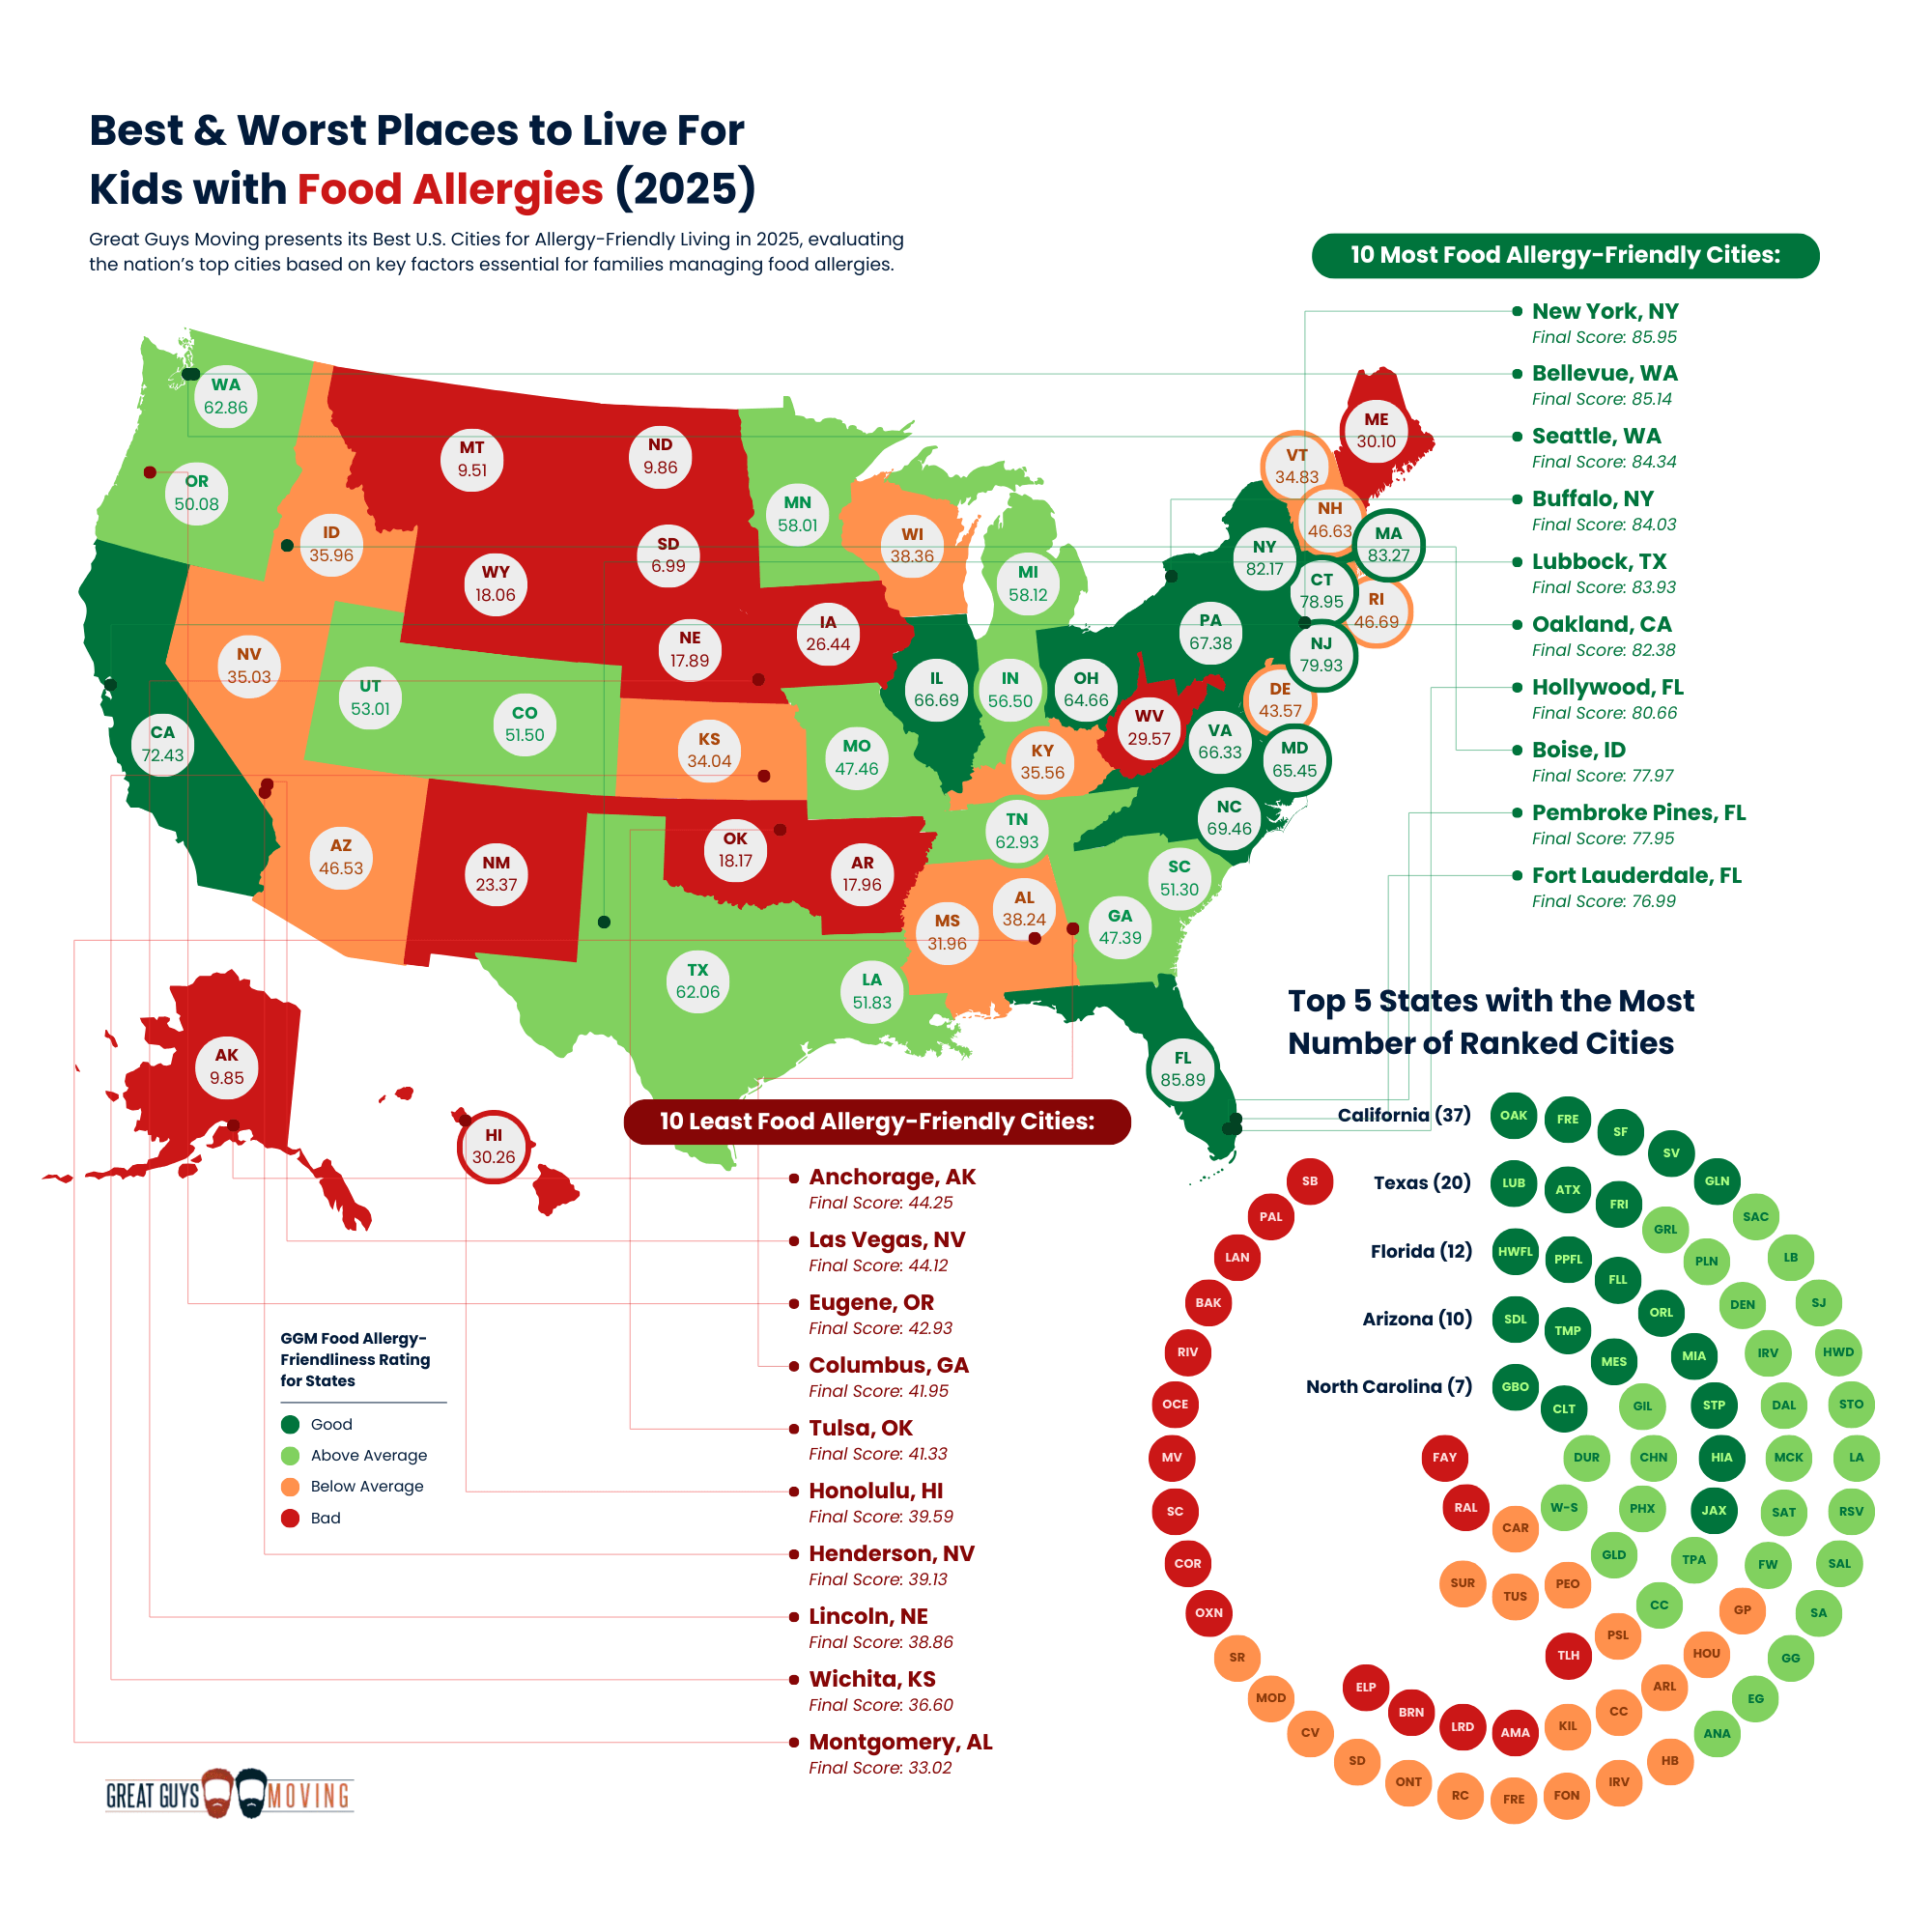
- 10 Most Food Allergy Friendly Cities in the US
- 10 Least Food Allergy Friendly Cities in the US
- Cities with the Most Allergy-Friendly Grocery Stores
- Cities with the Quickest Access to Healthcare
- State Review of Childcare Food Allergy Initiatives
- GGM Food Allergy-Friendliness Rating
- Data and Methodology
- Contact Us
For families managing food allergies, choosing the right city to call home can make all the difference in the quality of daily life. Access to safe food options, supportive healthcare, and allergy-friendly resources are essential factors that impact every aspect of life. In recent years, many U.S. cities have improved their infrastructure to support families dealing with food allergies, but some stand out as the best environments for allergy-friendly living.
To determine the most and least allergy-friendly places, this comprehensive study by Great Guys Moving (GGM) analyzed approximately 15,000 U.S. cities and 50 states across five key data categories. Ultimately, 177 of the largest cities and all 50 states were ranked based on their ability to support families with food allergies. The five data categories used are:
- Access to allergy-friendly grocery stores
- Nearby availability of longer-term immunotherapy options
- Quick access to a nearby Children's Hospital in the event of a life-threatening anaphylactic emergency
- Statewide anaphylaxis policies for school districts and childcare facilities
- Environmental factors affecting allergies unique to a city or state
Based on their overall performance across these metrics, the cities and states were classified as Good, Above Average, Below Average, or Bad in terms of their support for families managing food allergies.
So, whether you're planning a move or simply curious about the best place to live if you have food allergies, these rankings provide an essential look at where to live, work, and thrive with food allergies in 2025.

Key Findings
- GGM's Top Food Allergy-Friendly City: New York City, NY (final score: 85.948) with a population of 8,258,035
- GGM's Least Food Allergy-Friendly City: Montgomery, AL (final score: 33.019) with a population of 195,287
- Top City by Grocery Count: New York City, NY with 128 allergy- friendly grocery stores
- Top City by Grocery Count per Capita: Jersey City, NJ has 4.1 allergy- friendly grocery stores per 10,000 people - or 1 store per 2,430 residents
- Top State with the most number of OIT Specialists: Texas with 16 OIT Specialists
- Top State with the most number of Children's Hospital: California with 23 Children's Hospitals
- State with the most number of Good-rated cities: Florida with 8 good-rated cities (Hollywood, Pembroke Pines, Fort Lauderdale, Orlando, Miami, St. Petersburg, Hialeah and Jacksonville)
- State with the most number of Bad-rated cities: Califonia with 10 bad-rated cities (Oxnard, Corona, Santa Clarita, Moreno Valley, Oceanside, Riverside, Bakersfield, Lancaster, Palmdale and San Bernardino)
- The state of California dominates our top 10 list of most allergy- friendly grocery stores with four cities (Glendale, Sunnyvale, Garden Grove, and Roseville)

Full Results
| # | City & Population | Final Score | Grocery Stores within 10 miles | Nearest OIT Specialist (miles) | Nearest Children's Hospital (miles) | Statewide Childcare Policies Rating | Hybrid AAFA City Score |
|---|---|---|---|---|---|---|---|
| 1 | New York, NY 8,258,035 | 85.948 | 128 0.155 per 10k people | 1.6 Latitude Food Allergy Care | 2.731 Hassenfeld Children's Hospital |  | 75.8 |
| 2 | Bellevue, WA 151,574 | 85.135 | 32 2.111 per 10k people | 0.9 Columbia Allergy - Bellevue | 6.57 Seattle Children's |  | 84.5 |
| 3 | Seattle, WA 755,078 | 84.341 | 29 0.384 per 10k people | 6.9 Columbia Allergy - Bellevue | 0.206 Seattle Children's | | 87.3 |
| 4 | Buffalo, NY 274,678 | 84.033 | 15 0.546 per 10k people | 1.1 University at Buffalo Pediatric Associates | 1.114 John R. Oishei Children's Hospital | | 21.1 |
| 5 | Lubbock, TX 266,878 | 83.93 | 12 0.45 per 10k people | 1 The Food Allergy Center for Excellence | 1.413 Covenant Children's Hospital |  | 55.8 |
| 6 | Oakland, CA 436,504 | 82.384 | 31 0.71 per 10k people | 0.6 Columbia Allergy - Oakland | 1.505 Kaiser Permanente - Oakland Medical Center |  | 96.2 |
| 7 | Hollywood, FL 153,859 | 80.656 | 22 1.43 per 10k people | 1.9 Joe DiMaggio Children's Hospital | 1.878 Joe DiMaggio Children's Hospital |  | 26.9 |
| 8 | Boise, ID 235,421 | 77.972 | 10 0.425 per 10k people | 2.6 The Allergy Group - Boise | 0.503 St. Luke's Children's Hospital |  | 98.0 |
| 9 | Pembroke Pines, FL 171,119 | 77.948 | 32 1.87 per 10k people | 3.1 Joe DiMaggio Children's Hospital | 3.042 Joe DiMaggio Children's Hospital | | 26.7 |
| 10 | Fort Lauderdale, FL 184,255 | 76.989 | 32 1.737 per 10k people | 7.4 Joe DiMaggio Children's Hospital | 1.397 Salah Foundation Children's Hospital | | 30.0 |
| 11 | St. Paul, MN 303,820 | 76.738 | 34 1.119 per 10k people | 6.1 Allergy and Asthma Center of Minnesota | 0.482 Gillette Children's Specialty Healthcare |  | 26.9 |
| 12 | Salt Lake City, UT 209,593 | 76.604 | 29 1.384 per 10k people | 7.2 Tanner Clinic - Murray | 2.258 Shriners Children's Salt Lake City |  | 97.8 |
| 13 | Boston, MA 653,833 | 75.755 | 27 0.413 per 10k people | 8.9 The New England Food Allergy Treatment Center-Boston | 0.466 Shriners Children's Boston |  | 36.9 |
| 14 | Orlando, FL 320,742 | 75.728 | 42 1.309 per 10k people | 8.8 Allergy Asthma Specialists - Orlando | 1.31 Arnold Palmer Hospital for Children | | 26.1 |
| 15 | Fremont, CA 226,208 | 75.346 | 9 0.398 per 10k people | 0.3 Columbia Allergy - Fremont | 12.81 Lucile Packard Children's Hospital at Stanford | | 88.6 |
| 16 | Tacoma, WA 222,906 | 75.273 | 13 0.583 per 10k people | 28.6 Columbia Allergy - Bellevue | 1.002 Mary Bridge Children's Hospital | | 75.1 |
| 17 | Minneapolis, MN 425,115 | 74.992 | 43 1.011 per 10k people | 8.4 Advancements in Allergy & Asthma Care | 0.407 Hennepin County Medical Center | | 22.6 |
| 18 | Washington, DC 678,972 | 74.96 | 41 0.604 per 10k people | 5.3 The Institute for Asthma and Allergy | 2.512 Children's National Hospital |  | 67.1 |
| 19 | Scottsdale, AZ 244,394 | 74.67 | 18 0.737 per 10k people | 0.7 Allergy, Asthma & Immunology Associates | 6.704 Phoenix Children's Hospital |  | 87.8 |
| 20 | Paterson, NJ 156,452 | 74.088 | 27 1.726 per 10k people | 7.9 Allergy Partners of NJ - Teaneck | 1.027 St. Joseph's Children's Hospital |  | 69.1 |
| 21 | Newark, NJ 304,960 | 73.789 | 45 1.476 per 10k people | 9.9 Latitude Food Allergy Care | 0.944 University Hospital Pediatrics | | 73.2 |
| 22 | San Francisco, CA 808,988 | 73.534 | 35 0.433 per 10k people | 8.7 Columbia Allergy - Oakland | 1.89 UCSF Benioff Children's Hospital | | 100.0 |
| 23 | Greensboro, NC 302,296 | 73.018 | 7 0.232 per 10k people | 1.2 Allergy and Asthma Center of North Carolina | 1.268 Cone Health Women's & Children's Center at Moses Cone Hospital |  | 17.1 |
| 24 | Jersey City, NJ 291,657 | 72.428 | 120 4.114 per 10k people | 5.1 Latitude Food Allergy Care | 5.574 Hassenfeld Children's Hospital | | 74.5 |
| 25 | Springfield, MA 153,672 | 71.725 | 0 0 per 10k people | 52.4 Northeast Allergy Asthma and Immunology | 1.356 Shriners Children's New England | | 66.3 |
| 26 | Tempe, AZ 189,834 | 71.012 | 20 1.054 per 10k people | 4.4 Allergy, Asthma & Immunology Associates | 4.37 Banner Children's at Desert | | 88.4 |
| 27 | Reno, NV 274,915 | 70.842 | 17 0.618 per 10k people | 5.7 Northern Nevada Allergy | 0.931 Renown Children's Hospital |  | 70.5 |
| 28 | Overland Park, KS 197,089 | 70.759 | 29 1.471 per 10k people | 2.9 Prairie Allergy | 3.533 Children's Mercy Hospital Kansas |  | 23.7 |
| 29 | Aurora, CO 395,052 | 70.615 | 38 0.962 per 10k people | 3.6 Colorado Allergy and Asthma Centers | 0.857 Children's Hospital Colorado Anschutz Medical Campus, Aurora |  | 21.7 |
| 30 | Vancouver, WA 196,442 | 70.521 | 25 1.273 per 10k people | 8.3 Columbia Allergy - Vancouver | 5.955 Randall Children's Hospital at Legacy Emanuel | | 31.2 |
| 31 | Charlotte, NC 911,311 | 70.461 | 10 0.11 per 10k people | 1.3 Allergy Asthma & Immunology Relief | 1.494 Hemby Children's Hospital | | 22.1 |
| 32 | Norfolk, VA 230,930 | 70.42 | 2 0.087 per 10k people | 1.2 CHKD Allergy | 1.23 Children's Hospital of The King's Daughters |  | 27.0 |
| 33 | Sunnyvale, CA 151,967 | 70.403 | 30 1.974 per 10k people | 13 Columbia Allergy - Fremont | 3.045 Kaiser Foundation Hospital - Santa Clara | | 90.9 |
| 34 | Philadelphia, PA 1,550,542 | 70.256 | 19 0.123 per 10k people | 0.4 Chestnut Hill Allergy & Asthma Associates | 1.634 Children's Hospital of Philadelphia |  | 34.1 |
| 35 | Miami, FL 455,924 | 70.141 | 15 0.329 per 10k people | 17.1 Joe DiMaggio Children's Hospital | 1.661 Holtz Children's Hospital | | 18.8 |
| 36 | Glendale, CA 187,050 | 70.004 | 42 2.245 per 10k people | 6.2 Adult & Children Allergy Asthma Center | 4.215 Children's Hospital Los Angeles | | 72.7 |
| 37 | Worcester, MA 207,621 | 69.857 | 9 0.433 per 10k people | 19.8 Northeast Allergy Asthma and Immunology | 2.303 UMass Memorial Children's Medical Center | | 39.8 |
| 38 | St. Petersburg, FL 263,553 | 69.78 | 22 0.835 per 10k people | 33.7 Food Allergy Center of Florida | 1.806 Johns Hopkins All Children's Hospital | | 31.8 |
| 39 | Austin, TX 979,882 | 69.763 | 21 0.214 per 10k people | 5 Aspire Allergy & Sinus - Austin | 3.139 Dell Children's Medical Center of Central Texas | | 13.1 |
| 40 | Hialeah, FL 221,300 | 69.463 | 22 0.994 per 10k people | 12.9 Joe DiMaggio Children's Hospital | 6.14 Holtz Children's Hospital | | 22.8 |
| 41 | Jacksonville, FL 985,843 | 69.431 | 20 0.203 per 10k people | 129.7 Allergy Asthma Specialists - Orlando | 1.245 Wolfson Children's Hospital | | 82.7 |
| 42 | Alexandria, VA 155,230 | 68.827 | 33 2.126 per 10k people | 11 The Institute for Asthma and Allergy | 8.608 Children's National Hospital | | 65.9 |
| 43 | Frisco, TX 225,007 | 68.716 | 18 0.8 per 10k people | 3.3 Allergy Partners of North Texas - Frisco | 16.75 Medical City Children's Hospital | | 19.4 |
| 44 | Denver, CO 716,577 | 68.619 | 55 0.768 per 10k people | 4.7 Colorado Allergy and Asthma Centers | 1.014 Children's Hospital Colorado | | 17.7 |
| 45 | Mesa, AZ 511,648 | 68.396 | 15 0.293 per 10k people | 7 Allergy, Asthma & Immunology Associates | 3.166 Banner Children's at Desert | | 86.3 |
| 46 | Atlanta, GA 510,823 | 67.482 | 39 0.763 per 10k people | 23.1 Chacko Allergy Asthma and Sinus Center | 0.582 Children's Healthcare of Atlanta |  | 82.1 |
| 47 | Birmingham, AL 196,644 | 67.451 | 14 0.712 per 10k people | 3 Pediatric & Adult Asthma and Allergy P.C | 1.078 Children's of Alabama |  | 29.3 |
| 48 | Naperville, IL 150,245 | 67.069 | 21 1.398 per 10k people | 2.3 Oak Brook Allergists | 20.889 Shriners Children's Chicago |  | 79.5 |
| 49 | Sacramento, CA 526,384 | 66.97 | 29 0.551 per 10k people | 42 Allergy, Immunology & Asthma Medical Group, INC | 1.496 Children's Center at Sutter Medical Center | | 96.1 |
| 50 | Garland, TX 243,470 | 66.967 | 14 0.575 per 10k people | 7.8 Allergy Partners of North Texas - Dallas | 7.834 Medical City Children's Hospital | | 13.7 |
| 51 | Long Beach, CA 449,468 | 66.896 | 15 0.334 per 10k people | 10.5 Palos Verdes Medical Group | 2.732 Miller Children's Hospital | | 67.0 |
| 52 | Plano, TX 290,190 | 66.728 | 18 0.62 per 10k people | 8.5 Allergy Partners of North Texas - Dallas | 8.472 Medical City Children's Hospital | | 15.8 |
| 53 | San Jose, CA 969,655 | 66.692 | 34 0.351 per 10k people | 15.8 Columbia Allergy - Fremont | 5.983 Kaiser Foundation Hospital - Santa Clara | | 94.1 |
| 54 | Denton, TX 158,349 | 66.562 | 4 0.253 per 10k people | 2.7 Family Allergy & Asthma Care - Denton | 28.392 Medical City Children's Hospital | | 22.5 |
| 55 | Rochester, NY 207,274 | 66.549 | 19 0.917 per 10k people | 65.7 UBMD Pediatrics/ Allergy | 2.469 Golisano Children's Hospital | | 19.7 |
| 56 | Hayward, CA 155,675 | 66.547 | 15 0.964 per 10k people | 9.6 Columbia Allergy - Fremont | 14.435 Kaiser Permanente - Oakland Medical Center | | 91.4 |
| 57 | Grand Rapids, MI 196,608 | 66.45 | 7 0.356 per 10k people | 4.5 Allergy Associates of Western Michigan - Grand Rapids | 0.476 Helen DeVos Children's Hospital |  | 29.5 |
| 58 | New Orleans, LA 364,136 | 66.397 | 5 0.137 per 10k people | 4 Hoyt Institute of Food Allergy | 4.1 Children's Hospital of New Orleans |  | 14.3 |
| 59 | Tampa, FL 403,364 | 66.077 | 30 0.744 per 10k people | 44.7 Food Allergy Center of Florida | 3.063 St. Joseph's Children's Hospital | | 24.5 |
| 60 | Kansas City, KS 152,933 | 65.891 | 22 1.439 per 10k people | 9.4 Prairie Allergy | 3.342 Children's Mercy Hospital | | 19.9 |
| 61 | Durham, NC 296,186 | 65.66 | 5 0.169 per 10k people | 7.4 Allergy Partners of Chapel Hill | 2.085 Duke Children's Hospital | | 23.3 |
| 62 | Stockton, CA 319,543 | 65.628 | 5 0.156 per 10k people | 2.5 Allergy, Immunology & Asthma Medical Group, INC | 42.085 Shriners Children's Northern California | | 96.9 |
| 63 | St. Louis, MO 281,754 | 65.601 | 7 0.248 per 10k people | 12.8 Allergy, Asthma & Food Allergy Centers | 2.174 Cardinal Glennon Children's Hospital |  | 95.0 |
| 64 | Irving, TX 254,373 | 65.6 | 13 0.511 per 10k people | 11.4 Allergy Partners of North Texas - Dallas | 6.389 Children's Health, Dallas | | 11.6 |
| 65 | Charleston, SC 155,369 | 65.482 | 10 0.644 per 10k people | 2.6 Charleston Allergy & Asthma | 0.717 MUSC Shawn Jenkins Children's Hospital |  | 23.5 |
| 66 | Portland, OR 630,498 | 65.344 | 40 0.634 per 10k people | 7 Baker Allergy | 1.435 Shriners Children's Portland |  | 26.8 |
| 67 | Gilbert, AZ 275,411 | 65.243 | 15 0.545 per 10k people | 11.9 Allergy, Asthma & Immunology Associates | 5.707 Banner Children's at Desert | | 85.2 |
| 68 | Los Angeles, CA 3,820,914 | 65.186 | 52 0.136 per 10k people | 8.8 Adult & Children Allergy Asthma Center | 4.103 Children's Hospital Los Angeles | | 75.3 |
| 69 | Roseville, CA 159,135 | 64.942 | 31 1.948 per 10k people | 52.7 Allergy, Immunology & Asthma Medical Group, INC | 2.136 Kaiser Foundation Hospital - Roseville, Women's and Children's Services | | 89.5 |
| 70 | Akron, OH 188,701 | 64.911 | 4 0.212 per 10k people | 14.5 Allergy Asthma & Sinus Relief Center - Twinsburg | 0.433 Akron Children's Hospital |  | 75.8 |
| 71 | Dallas, TX 1,302,868 | 64.767 | 14 0.107 per 10k people | 9.4 Allergy Partners of North Texas - Dallas | 2.049 Texas Scottish Rite Hospital for Children | | 6.3 |
| 72 | Chandler, AZ 280,167 | 64.654 | 16 0.571 per 10k people | 13.2 Allergy, Asthma & Immunology Associates | 6.153 Banner Children's at Desert | | 85.6 |
| 73 | Phoenix, AZ 1,650,070 | 64.51 | 13 0.079 per 10k people | 6.5 Allergy Partners of Phoenix | 2.829 Phoenix Children's Hospital | | 91.5 |
| 74 | Glendale, AZ 253,855 | 64.09 | 15 0.591 per 10k people | 11.7 Allergy Partners of Phoenix | 9.341 Phoenix Children's Hospital | | 87.3 |
| 75 | Salinas, CA 159,506 | 64.025 | 2 0.125 per 10k people | 1.1 Central Coast Allergy and Asthma | 49.502 Kaiser Foundation Hospital - Santa Clara | | 78.6 |
| 76 | Louisville, KY 622,981 | 63.86 | 8 0.128 per 10k people | 94 Cincinnati Allergy and Asthma Center | 0.682 Norton Children's Hospital |  | 82.6 |
| 77 | Chicago, IL 2,664,452 | 63.853 | 28 0.105 per 10k people | 15.5 Kenilworth Medical Associates | 1.434 Ann and Robert H. Lurie Children's Hospital of Chicago | | 88.0 |
| 78 | McKinney, TX 213,509 | 63.348 | 7 0.328 per 10k people | 8.8 Texas Allergy MD | 21.776 Medical City Children's Hospital | | 21.5 |
| 79 | Aurora, IL 177,563 | 63.252 | 13 0.732 per 10k people | 4.1 Kaneland Allergy and Asthma Center | 29.102 Shriners Children's Chicago | | 77.6 |
| 80 | Santa Ana, CA 310,539 | 63.24 | 35 1.127 per 10k people | 28.8 Palos Verdes Medical Group | 2.19 Children's Hospital of Orange County | | 59.5 |
| 81 | Providence, RI 190,792 | 63.124 | 4 0.21 per 10k people | 34.9 The New England Food Allergy Treatment Center-Boston | 0.909 Women & Infants Hospital of Rhode Island |  | 35.9 |
| 82 | Winston Salem, NC 252,975 | 62.725 | 13 0.514 per 10k people | 25.5 Allergy and Asthma Center of North Carolina | 1.594 Atrium Health Levine Children's Brenner Children's Hospital | | 19.5 |
| 83 | San Antonio, TX 1,495,295 | 62.695 | 6 0.04 per 10k people | 4.3 Aspire Allergy and Sinus | 0.307 CHRISTUS Children's | | 9.9 |
| 84 | Garden Grove, CA 168,234 | 62.382 | 33 1.962 per 10k people | 24.5 Palos Verdes Medical Group | 4.63 Children's Hospital of Orange County | | 61.6 |
| 85 | Elk Grove, CA 178,444 | 62.369 | 13 0.729 per 10k people | 29.1 Allergy, Immunology & Asthma Medical Group, INC | 10.936 Shriners Children's Northern California | | 90.4 |
| 86 | Milwaukee, WI 561,385 | 62.207 | 18 0.321 per 10k people | 58.8 Consultants in Allergy & Asthma Care - Highland Park | 5.155 Children's Wisconsin |  | 86.0 |
| 87 | Fort Worth, TX 978,468 | 62.085 | 8 0.082 per 10k people | 24.5 Family Allergy & Asthma Care - Flower Mound | 1.202 Cook Children's Healthcare System | | 19.9 |
| 88 | Cape Coral, FL 224,455 | 61.79 | 21 0.936 per 10k people | 58.3 Food Allergy Center of Florida | 8.054 Golisano Children's Hospital of Southwest Florida | | 22.0 |
| 89 | Anaheim, CA 340,512 | 61.651 | 22 0.646 per 10k people | 25.2 Adult & Children Allergy Asthma Center | 4.567 Children's Hospital of Orange County | | 61.1 |
| 90 | Columbus, OH 913,175 | 61.608 | 9 0.099 per 10k people | 11 Ohio ENT and Allergy Physicians | 1.294 Nationwide Children's Hospital | | 77.6 |
| 91 | Peoria, AZ 198,750 | 61.349 | 10 0.503 per 10k people | 15.3 Allergy Partners of Phoenix | 13.337 Phoenix Children's Hospital | | 85.6 |
| 92 | Port St. Lucie, FL 245,021 | 60.657 | 20 0.816 per 10k people | 37.1 Allergy Associates of the Palm Beaches | 41.15 Palm Beach Children's Hospital | | 40.4 |
| 93 | Chattanooga, TN 187,030 | 60.408 | 6 0.321 per 10k people | 90 Chacko Allergy Asthma and Sinus Center | 1.1 Children's Hospital at Erlanger |  | 27.3 |
| 94 | Pittsburgh, PA 303,255 | 60.4 | 13 0.429 per 10k people | 16 Allergy, Asthma, Sinus Wellness Center LLC | 2.601 UPMC Children's Hospital of Pittsburgh | | 29.4 |
| 95 | Newport News, VA 183,118 | 60.389 | 3 0.164 per 10k people | 10.6 CHKD Allergy | 10.63 Children's Hospital of The King's Daughters | | 31.7 |
| 96 | Cincinnati, OH 311,097 | 60.348 | 7 0.225 per 10k people | 4.8 Cincinnati Allergy and Asthma Center | 2.748 Cincinnati Children's Hospital Medical Center | | 34.4 |
| 97 | Huntington Beach, CA 192,129 | 60.107 | 25 1.301 per 10k people | 22.4 Palos Verdes Medical Group | 10.45 Children's Hospital of Orange County | | 62.1 |
| 98 | Spokane, WA 229,447 | 59.901 | 13 0.567 per 10k people | 221.7 Columbia Allergy - Bellevue | 0.446 Shriners Children's Spokane | | 22.4 |
| 99 | Grand Prairie, TX 202,134 | 59.806 | 8 0.396 per 10k people | 23 Allergy Partners of North Texas - Dallas | 15.311 Children's Health, Dallas | | 14.7 |
| 100 | Tucson, AZ 547,239 | 59.78 | 14 0.256 per 10k people | 3.9 Allergy & Asthma Associates of Tucson | 96.178 Banner Children's at Desert | | 92.3 |
| 101 | Lakewood, CO 155,961 | 59.301 | 40 2.565 per 10k people | 12.8 Colorado Allergy and Asthma Centers | 10.943 Children's Hospital Colorado | | 22.6 |
| 102 | Irvine, CA 314,621 | 59.215 | 33 1.049 per 10k people | 32 Palos Verdes Medical Group | 6.952 Children's Hospital of Orange County | | 58.2 |
| 103 | Kansas City, MO 510,704 | 59.085 | 24 0.47 per 10k people | 8.9 Prairie Allergy | 1.122 Children's Mercy Hospital | | 18.5 |
| 104 | Cleveland, OH 362,656 | 59.033 | 4 0.11 per 10k people | 13.3 University Hospitals Allergy Practice | 3.747 Cleveland Clinic Children's Hospital | | 79.7 |
| 105 | Lexington, KY 320,154 | 59.003 | 3 0.094 per 10k people | 76 Cincinnati Allergy and Asthma Center | 1.241 University of Kentucky Children's Hospital | | 59.7 |
| 106 | Joliet, IL 150,489 | 58.576 | 9 0.598 per 10k people | 15.7 Oak Brook Allergists | 22.715 Advocate Children's Hospital | | 78.3 |
| 107 | Fontana, CA 215,465 | 58.496 | 4 0.186 per 10k people | 40.4 Adult & Children Allergy Asthma Center | 1.359 Kaiser Permanente Pediatric Care Center, Fontana | | 46.5 |
| 108 | Houston, TX 2,314,157 | 58.491 | 11 0.048 per 10k people | 6.6 Bellaire Allergy & Asthma | 3.563 Children's Memorial Hermann Hospital | | 8.9 |
| 109 | Fresno, CA 545,716 | 58.266 | 13 0.238 per 10k people | 108.1 Central Coast Allergy and Asthma | 4.307 Community Regional Medical Center | | 93.6 |
| 110 | Cary, NC 180,010 | 58.074 | 22 1.222 per 10k people | 17 Allergy Partners of Chapel Hill | 17.106 North Carolina Children's Hospital | | 19.6 |
| 111 | Arlington, TX 398,431 | 58.002 | 6 0.151 per 10k people | 23 Family Allergy & Asthma Care - Flower Mound | 13.87 Cook Children's Healthcare System | | 16.0 |
| 112 | Richmond, VA 229,247 | 57.905 | 10 0.436 per 10k people | 68.4 Charlottesville Allergy & Respiratory Enterprises (CARE) | 2.416 Children's Hospital of Richmond at VCU | | 25.2 |
| 113 | Shreveport, LA 177,959 | 57.83 | 5 0.281 per 10k people | 176.9 Allergy Partners of North Texas - Dallas | 2.879 Shriners Children's Shreveport | | 48.9 |
| 114 | Corpus Christi, TX 316,595 | 57.52 | 4 0.126 per 10k people | 133.4 Aspire Allergy and Sinus | 3.233 Driscoll Children's Hospital | | 41.8 |
| 115 | Indianapolis, IN 879,293 | 57.346 | 9 0.102 per 10k people | 100.7 The Allergy and Asthma Center | 1.349 Riley Hospital for Children |  | 85.8 |
| 116 | Knoxville, TN 198,162 | 57.258 | 4 0.202 per 10k people | 132.3 Chacko Allergy Asthma and Sinus Center | 1.031 East Tennessee Children's Hospital | | 23.8 |
| 117 | Baltimore, MD 565,239 | 57.248 | 24 0.425 per 10k people | 32.3 Whole Family Allergy and Immunotherapy | 0.684 Kennedy Krieger Institute |  | 40.2 |
| 118 | Fort Wayne, IN 269,994 | 57.161 | 9 0.333 per 10k people | 5.6 The Allergy and Asthma Center | 71.217 Beacon Children's Hospital | | 56.1 |
| 119 | Rancho Cucamonga, CA 174,405 | 57.112 | 10 0.573 per 10k people | 32.4 Adult & Children Allergy Asthma Center | 8.386 Kaiser Permanente Pediatric Care Center, Fontana | | 50.8 |
| 120 | Ontario, CA 182,457 | 56.728 | 11 0.603 per 10k people | 28.6 Adult & Children Allergy Asthma Center | 12.317 Kaiser Permanente Pediatric Care Center, Fontana | | 53.0 |
| 121 | San Diego, CA 1,388,320 | 56.673 | 20 0.144 per 10k people | 12 Modena Allergy and Asthma | 5.607 Rady Children's Hospital | | 28.3 |
| 122 | Surprise, AZ 158,285 | 56.306 | 4 0.253 per 10k people | 23.5 Allergy Partners of Phoenix | 21.529 Phoenix Children's Hospital | | 82.5 |
| 123 | Chula Vista, CA 274,333 | 55.523 | 13 0.474 per 10k people | 18.7 Modena Allergy and Asthma | 11.588 Rady Children's Hospital | | 31.0 |
| 124 | Modesto, CA 218,915 | 55.205 | 9 0.411 per 10k people | 29.7 Allergy, Immunology & Asthma Medical Group, INC | 58.827 Kaiser Foundation Hospital - Santa Clara | | 86.0 |
| 125 | Macon, GA 156,512 | 55.141 | 2 0.128 per 10k people | 92.3 Chacko Allergy Asthma and Sinus Center | 0.469 Atrium Health Levine Children's Beverly Knight Olson Children's Hospital | | 62.2 |
| 126 | Mobile, AL 182,595 | 55.04 | 4 0.219 per 10k people | 52.3 Allergy Asthma and Immunology | 2.073 USA Children's and Women's Hospital | | 49.1 |
| 127 | Albuquerque, NM 560,274 | 54.793 | 32 0.571 per 10k people | 290.9 The Food Allergy Center for Excellence | 1.507 Carrie Tingley Hospital |  | 87.0 |
| 128 | Santa Rosa, CA 175,845 | 54.465 | 18 1.024 per 10k people | 47.5 Allergy & Asthma Medical Group of the Bay Area - Berkeley | 48.251 UCSF Benioff Children's Hospital Oakland | | 84.7 |
| 129 | Killeen, TX 159,643 | 54.436 | 2 0.125 per 10k people | 53.5 Aspire Allergy & Sinus - Austin | 21.072 McLane Children's Hospital | | 33.3 |
| 130 | Huntsville, AL 225,564 | 54.405 | 5 0.222 per 10k people | 87.3 Pediatric & Adult Asthma and Allergy P.C | 0.905 Huntsville Hospital for Women and Children | | 48.4 |
| 131 | Nashville, TN 687,788 | 54.215 | 14 0.204 per 10k people | 182.1 The Tankersley Clinic | 2.23 Monroe Carell Jr. Children's Hospital at Vanderbilt | | 24.4 |
| 132 | Baton Rouge, LA 219,573 | 54.01 | 5 0.228 per 10k people | 71.1 Hoyt Institute of Food Allergy | 6.177 Our Lady of the Lake Children's Hospital | | 10.8 |
| 133 | Little Rock, AR 203,842 | 53.968 | 6 0.294 per 10k people | 147.6 The Tankersley Clinic | 0.267 Arkansas Children's Hospital |  | 16.0 |
| 134 | Oxnard, CA 198,488 | 53.923 | 6 0.302 per 10k people | 54.8 Palos Verdes Medical Group | 34.925 Cottage Children's Medical Center | | 86.6 |
| 135 | Corona, CA 160,238 | 53.896 | 7 0.437 per 10k people | 37.8 Adult & Children Allergy Asthma Center | 15.621 Kaiser Permanente Pediatric Care Center, Fontana | | 49.8 |
| 136 | Santa Clarita, CA 224,028 | 53.501 | 3 0.134 per 10k people | 28.6 Adult & Children Allergy Asthma Center | 23.122 Mattel Children's Hospital UCLA | | 68.9 |
| 137 | Raleigh, NC 482,295 | 53.344 | 13 0.27 per 10k people | 24 Allergy Partners of Chapel Hill | 22.884 Duke Children's Hospital | | 15.3 |
| 138 | Moreno Valley, CA 212,392 | 53.336 | 7 0.33 per 10k people | 54 Adult & Children Allergy Asthma Center | 7.943 Loma Linda University Children's Hospital | | 44.1 |
| 139 | Oceanside, CA 170,020 | 53.277 | 7 0.412 per 10k people | 23.4 Modena Allergy and Asthma | 30.509 Rady Children's Hospital | | 47.3 |
| 140 | Tallahassee, FL 202,221 | 52.62 | 15 0.742 per 10k people | 173.9 Allergy Asthma and Immunology | 128.385 UF Health Shands Children's Hospital | | 62.9 |
| 141 | Virginia Beach, VA 453,649 | 52.244 | 2 0.044 per 10k people | 3 Allergy & Asthma Specialists | 17.946 Children's Hospital of The King's Daughters | | 17.5 |
| 142 | Madison, WI 280,305 | 52.068 | 12 0.428 per 10k people | 100.4 Consultants in Allergy & Asthma Care - Highland Park | 57.434 American Family Children's Hospital | | 86.3 |
| 143 | Riverside, CA 318,858 | 51.941 | 5 0.157 per 10k people | 44.6 Adult & Children Allergy Asthma Center | 8.512 Kaiser Permanente Pediatric Care Center, Fontana | | 42.9 |
| 144 | Toledo, OH 265,304 | 51.896 | 8 0.302 per 10k people | 52.6 The Food Allergy Clinic - Livonia | 1.109 Mercy Health — Children's Hospital | | 27.1 |
| 145 | Bakersfield, CA 413,381 | 51.386 | 2 0.048 per 10k people | 98.4 Adult & Children Allergy Asthma Center | 1.421 Lauren Small Children's Center at Bakersfield Memorial Hospital | | 87.0 |
| 146 | Memphis, TN 618,639 | 51.326 | 2 0.032 per 10k people | 20.5 The Tankersley Clinic | 0.579 St. Jude Children's Research Hospital | | 19.2 |
| 147 | Amarillo, TX 202,408 | 51.09 | 8 0.395 per 10k people | 112.8 The Food Allergy Center for Excellence | 112.966 Covenant Children's Hospital | | 54.6 |
| 148 | Colorado Springs, CO 488,664 | 50.728 | 23 0.471 per 10k people | 61.4 Colorado Allergy and Asthma Centers | 10.058 Children's Hospital Colorado Colorado Springs | | 15.6 |
| 149 | Des Moines, IA 210,381 | 49.914 | 17 0.808 per 10k people | 188.5 Prairie Allergy | 1.078 MercyOne Children's Hospital |  | 14.6 |
| 150 | Murfreesboro, TN 165,430 | 49.444 | 7 0.423 per 10k people | 165.2 Pediatric & Adult Asthma and Allergy P.C | 30.609 Monroe Carell Jr. Children's Hospital at Vanderbilt | | 36.4 |
| 151 | Laredo, TX 257,602 | 49.37 | 0 0 per 10k people | 148.7 Certified Allergy & Asthma of San Antonio - Medical Center | 118.174 Edinburg Children's Hospital | | 42.1 |
| 152 | Springfield, MO 170,188 | 49.178 | 12 0.705 per 10k people | 141.8 Prairie Allergy | 2.77 Mercy Children's Hospital - Springfield | | 47.5 |
| 153 | Lancaster, CA 166,236 | 49.145 | 2 0.12 per 10k people | 38.1 Adult & Children Allergy Asthma Center | 39.226 Shriners Children's Southern California | | 63.5 |
| 154 | Chesapeake, VA 253,886 | 49.029 | 1 0.039 per 10k people | 10.3 CHKD Allergy | 10.423 Children's Hospital of The King's Daughters | | 26.4 |
| 155 | Detroit, MI 633,218 | 48.931 | 3 0.047 per 10k people | 18.9 Allergy & Asthma Institute of SE Michigan - Farmington Hills | 1.448 Children's Hospital of Michigan | | 33.4 |
| 156 | Fort Collins, CO 170,376 | 48.679 | 16 0.939 per 10k people | 58.1 Colorado Allergy and Asthma Centers | 55.905 Children's Hospital Colorado | | 37.9 |
| 157 | Brownsville, TX 190,158 | 48.284 | 0 0 per 10k people | 253.6 Aspire Allergy and Sinus | 50.325 Edinburg Children's Hospital | | 29.7 |
| 158 | Fayetteville, NC 209,749 | 47.996 | 5 0.238 per 10k people | 62.1 Allergy Partners of Chapel Hill | 59.692 North Carolina Children's Hospital | | 33.9 |
| 159 | Clarksville, TN 180,716 | 47.805 | 4 0.221 per 10k people | 166.8 The Tankersley Clinic | 40.984 Monroe Carell Jr. Children's Hospital at Vanderbilt | | 41.1 |
| 160 | Sioux Falls, SD 206,410 | 47.25 | 6 0.291 per 10k people | 187 Allergy, Asthma & Pulmonary Associates, P.A. | 2.488 Sanford Health Children's Hospital |  | 48.9 |
| 161 | Salem, OR 177,432 | 47.159 | 3 0.169 per 10k people | 37.3 Baker Allergy & Asthma Clinic | 41.476 Providence St. Vincent Medical Center | | 40.1 |
| 162 | Augusta, GA 200,884 | 47.149 | 2 0.1 per 10k people | 128.7 Charleston Allergy & Asthma | 0.745 Children's Hospital of Georgia | | 28.8 |
| 163 | Oklahoma City, OK 702,767 | 46.998 | 12 0.171 per 10k people | 157 North Texas Allergy and Asthma Center | 1.231 The Children's Hospital of Oklahoma |  | 8.1 |
| 164 | Omaha, NE 483,335 | 46.868 | 12 0.248 per 10k people | 172.1 Prairie Allergy | 0.981 Boys Town National Research Hospital |  | 15.2 |
| 165 | Palmdale, CA 161,404 | 46.737 | 1 0.062 per 10k people | 29.9 Adult & Children Allergy Asthma Center | 31.069 Shriners Children's Southern California | | 64.1 |
| 166 | San Bernardino, CA 223,728 | 44.44 | 0 0 per 10k people | 126.1 Adult & Children Allergy Asthma Center | 85.998 Loma Linda University Children's Hospital | | 55.1 |
| 167 | El Paso, TX 678,958 | 44.294 | 3 0.044 per 10k people | 263.5 Allergy & Asthma Associates of Tucson | 1.82 El Paso Children's Hospital | | 17.6 |
| 168 | Anchorage, AK 286,075 | 44.253 | 5 0.175 per 10k people | 1 Bellingham Asthma Allergy & Immunology Clinic | 3.253 Providence Alaska Children's Hospital |  | 60.9 |
| 169 | Las Vegas, NV 660,929 | 44.115 | 15 0.227 per 10k people | 219.1 Adult & Children Allergy Asthma Center | 2.525 Sunrise Children's Hospital | | 20.0 |
| 170 | Eugene, OR 177,899 | 42.927 | 9 0.506 per 10k people | 97.8 Baker Allergy & Asthma Clinic | 101.996 Doernbecher Children's Hospital | | 48.3 |
| 171 | Columbus, GA 201,877 | 41.946 | 6 0.297 per 10k people | 118.5 Chacko Allergy Asthma and Sinus Center | 82.741 The Children's Hospital at The Medical Center of Central Georgia | | 63.3 |
| 172 | Tulsa, OK 411,894 | 41.33 | 7 0.17 per 10k people | 207.9 Texas Allergy MD | 7.035 The Children's Hospital at Saint Francis | | 10.2 |
| 173 | Honolulu, HI 341,778 | 39.587 | 6 0.176 per 10k people | 2 Latitude Food Allergy Care | 1.333 Shriners Children's Hawaii |  | 61.0 |
| 174 | Henderson, NV 337,305 | 39.129 | 5 0.148 per 10k people | 220.8 Adult & Children Allergy Asthma Center | 11.106 Sunrise Children's Hospital | | 26.2 |
| 175 | Lincoln, NE 294,757 | 38.855 | 12 0.407 per 10k people | 167.7 Prairie Allergy | 46.685 Children's Nebraska | | 33.8 |
| 176 | Wichita, KS 396,119 | 36.596 | 15 0.379 per 10k people | 171.5 Prairie Allergy | 136.603 The Children's Hospital at Saint Francis | | 0.0 |
| 177 | Montgomery, AL 195,287 | 33.019 | 1 0.051 per 10k people | 82 Pediatric & Adult Asthma and Allergy P.C | 83.938 Children's of Alabama | | 52.7 |

Cities with the Most Allergy-Friendly Grocery Stores
Top 10 Cities with the Most Allergy-Friendly Grocery Stores per Capita
| City | ST | Allergy-Friendly Grocery Stores w/in 10 miles | Population | Grocery Stores per 10,000 people | Overall Allergy-friendliness Rank |
|---|---|---|---|---|---|
| Jersey City | NJ | 120 | 291,657 | 4.1 | 24 |
| Lakewood | CO | 40 | 155,961 | 2.6 | 101 |
| Glendale | CA | 42 | 187,050 | 2.2 | 36 |
| Alexandria | VA | 33 | 155,230 | 2.1 | 42 |
| Bellevue | WA | 32 | 151,574 | 2.1 | 2 |
| Sunnyvale | CA | 30 | 151,967 | 2.0 | 33 |
| Garden Grove | CA | 33 | 168,234 | 2.0 | 84 |
| Roseville | CA | 31 | 159,135 | 1.9 | 69 |
| Pembroke Pines | FL | 32 | 171,119 | 1.9 | 9 |
| Fort Lauderdale | FL | 32 | 184,255 | 1.7 | 10 |
Jersey City, NJ, sets a remarkable standard in providing allergy-friendly grocery options, with 120 stores serving a population of just under 300,000. This translates to an impressive density of 1 store per 2,430 residents - the highest in our study.
While New York City has the highest total number of allergy-friendly stores at 128, its much larger population of 8 million dilutes its grocery store density, putting it at 1 store per 64,516 residents.
Interestingly, despite Lakewood having the second highest grocery store density in our rankings, it falls short in other areas and ranks 113th out of our 177 cities in terms of overall allergy friendliness.
The state of California dominates the list with four cities—Glendale, Sunnyvale, Garden Grove, and Roseville. South Florida also makes a notable showing with Pembroke Pines and Fort Lauderdale in this list.

Cities with Quickest Access to Healthcare

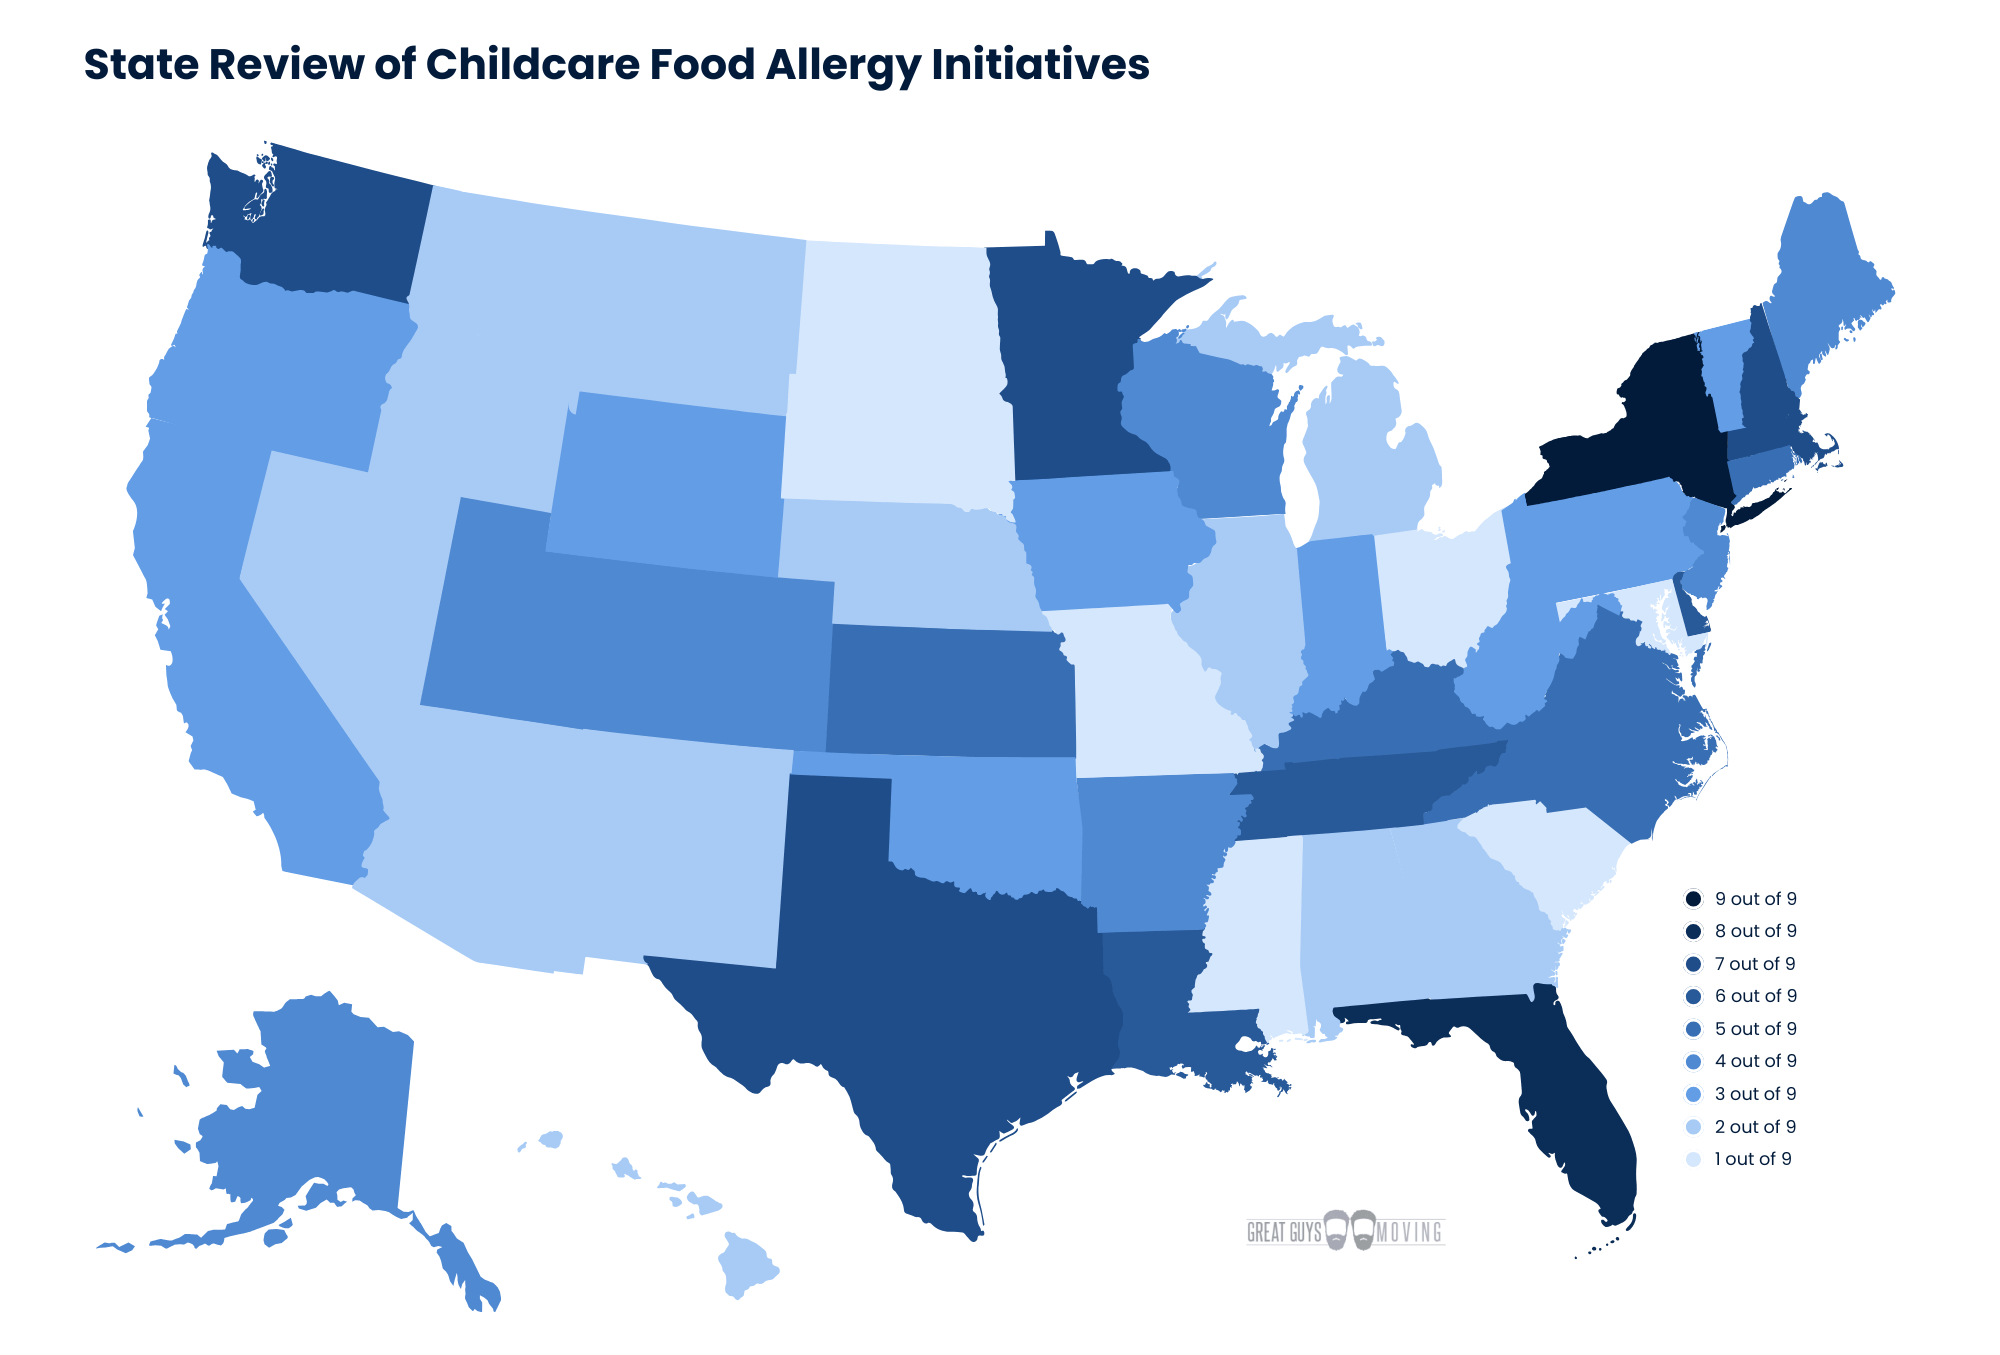
The map provides an overview of how each state scores on childcare food allergy initiatives. These initiatives vary widely across the U.S., with some states leading in protection while others lag behind - potentially putting children at risk. Published in Elijah's Law Report for U.S. States and Territories by AAFA, the 9-point score assigned to each state reflects how well they meet critical policy standards for managing food allergies in childcare settings. These standards include requirements like having food allergy action plans, providing epinephrine, training staff, and implementing preventative measures such as cross-contact guidelines and allergen labeling.
States like New York (9/9) set the benchmark for allergy-friendly childcare policies, excelling in all nine standards. Following closely are states like Florida (8/9) and Massachusetts, Minnesota, New Hampshire,Texas, and Washington (7/9), which exhibit strong frameworks but fall short in areas like cross-contact prevention or uniform policy implementation across childcare facilities.
Mid-scoring states such as Delaware, Louisiana, andTennessee (6/9) have foundational measures in place, like emergency protocols and allergen labeling, but lack more comprehensive training and preventative strategies.
On the other end of the spectrum, low-scoring states, such as Ohio, Maryland, Mississippi, Missouri, North Dakota, South Carolina, South Dakota (1/9) and territories like American Samoa, Puerto Rico, Virgin Islands (0/9) fail to meet even the most basic standards. These gaps leave children with food allergies vulnerable to preventable risks, such as cross-contact and delayed emergency responses.

GGM Food Allergy-Friendliness Rating
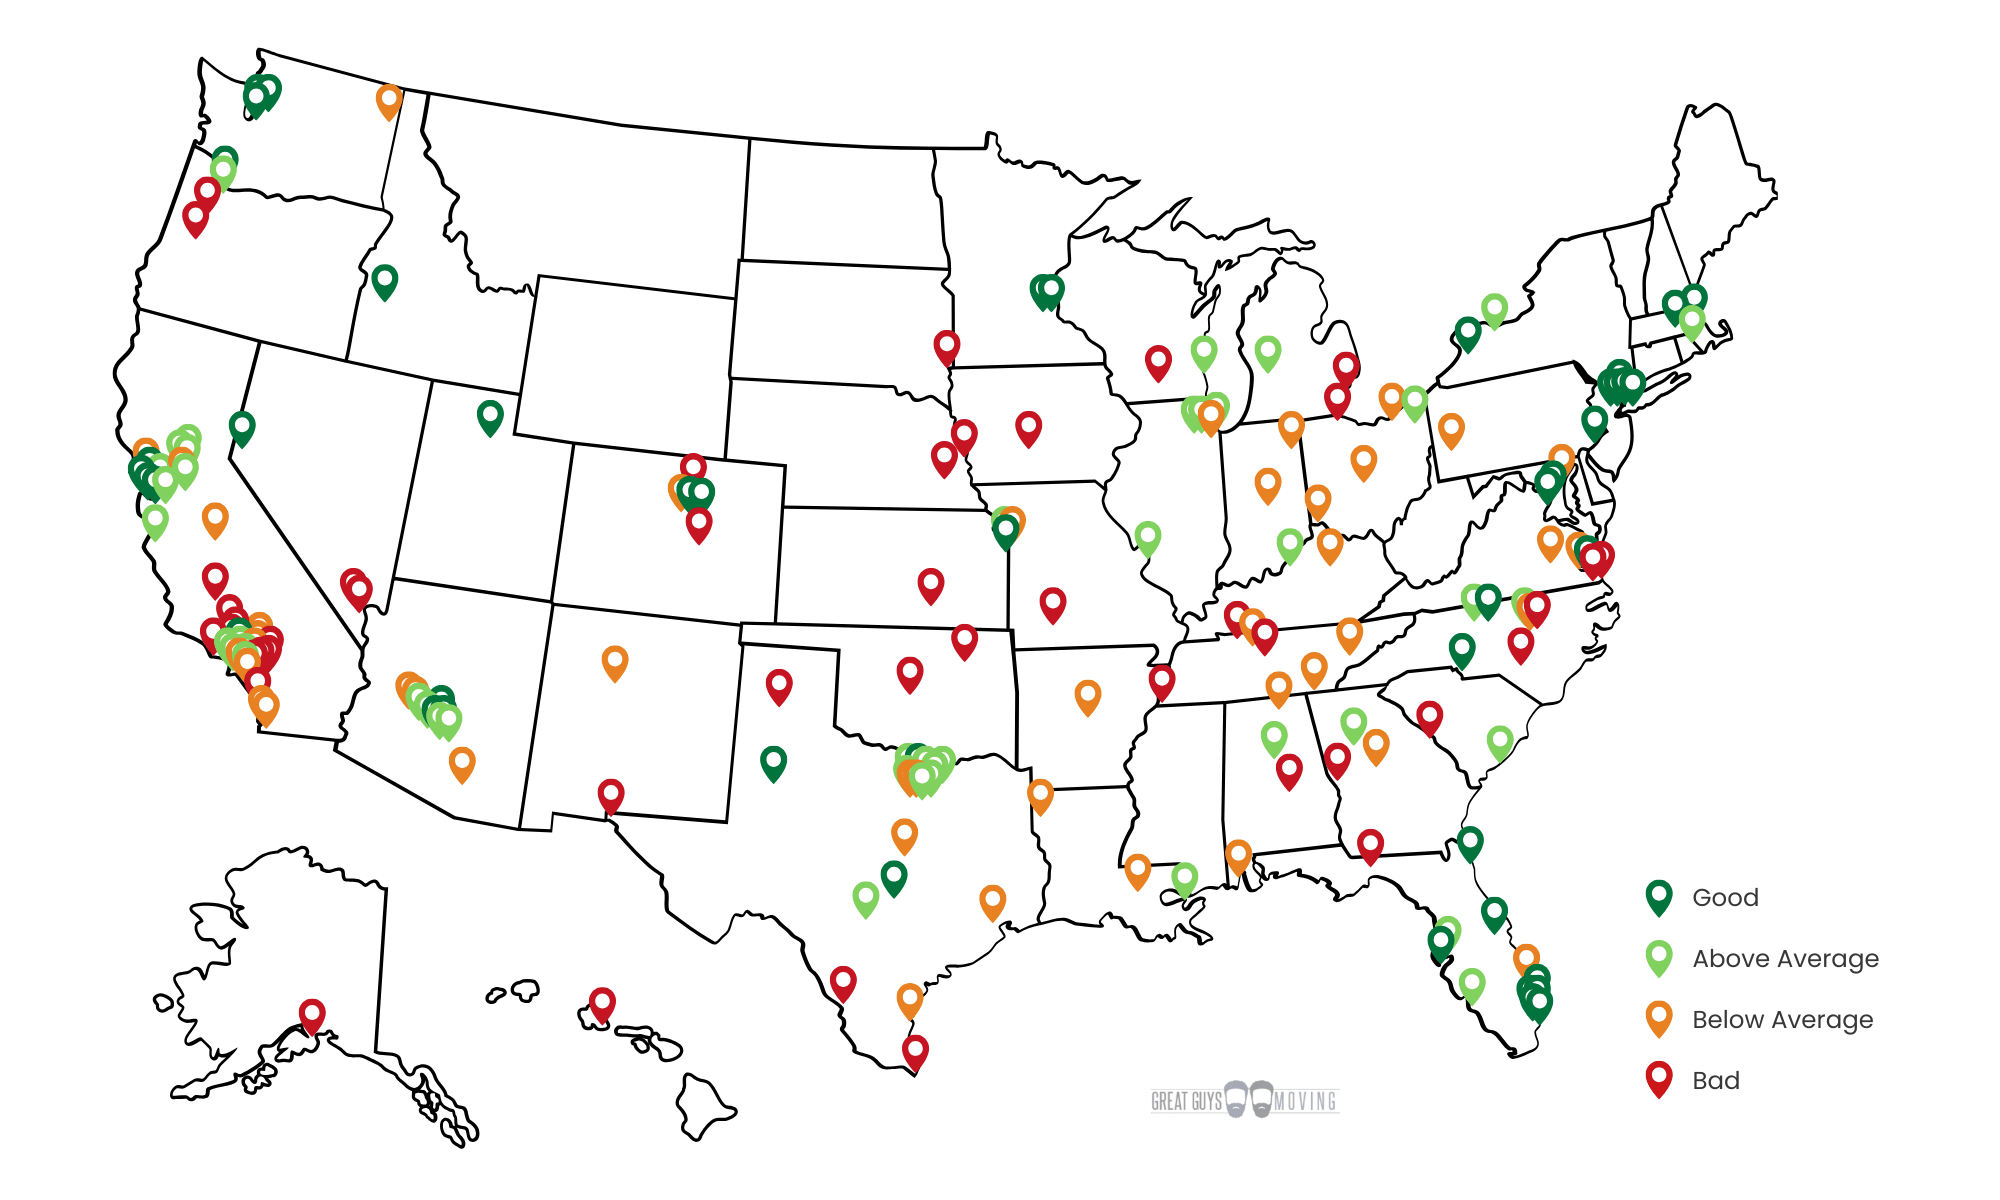
To help families navigate the best and worst locations for managing food allergies, we developed a clear rating system that classifies cities and states into four tiers: Good, Above Average, Below Average, and Bad.
Food Allergy-Friendly City Rating
From a city perspective, "Good" cities offer exceptional support for managing food allergies, while "Above Average" cities perform well but lack comprehensive resources. "Below Average" cities have one or more significant gaps in allergy-friendly resources, and "Bad" cities provide minimal support for managing food allergies.

Food-Allergy Friendly State Rating
Even though our statewide narrative is calculated slightly differently, it paints a similar picture. Higher-ranking states have more cities that are rated “Good” or “Above Average,” while lower-ranking states have a higher concentration of cities on the lower end of our city ranking.
| CA | 72.431 | OAK Oakland Final Score: 82.384 FRE Fremont Final Score: 75.346 SF San Francisco Final Score: 73.534 SV Sunnyvale Final Score: 70.403 GLN Glendale Final Score: 70.004 SAC Sacramento Final Score: 66.97 LB Long Beach Final Score: 66.896 SJ San Jose Final Score: 66.692 HWD Hayward Final Score: 66.547 STO Stockton Final Score: 65.628 LA Los Angeles Final Score: 65.186 RSV Roseville Final Score: 64.942 SAL Salinas Final Score: 64.025 SA Santa Ana Final Score: 63.24 GG Garden Grove Final Score: 62.382 EG Elk Grove Final Score: 62.369 ANA Anaheim Final Score: 61.651 HB Huntington Beach Final Score: 60.107 IRV Irvine Final Score: 59.215 FON Fontana Final Score: 58.496 FRE Fresno Final Score: 58.266 RC Rancho Cucamonga Final Score: 57.112 ONT Ontario Final Score: 56.728 SD San Diego Final Score: 56.673 CV Chula Vista Final Score: 55.523 MOD Modesto Final Score: 55.205 SR Santa Rosa Final Score: 54.465 OXN Oxnard Final Score: 53.923 COR Corona Final Score: 53.896 SC Santa Clarita Final Score: 53.501 MV Moreno Valley Final Score: 53.336 OCE Oceanside Final Score: 53.277 RIV Riverside Final Score: 51.941 BAK Bakersfield Final Score: 51.386 LAN Lancaster Final Score: 49.145 PAL Palmdale Final Score: 46.737 SB San Bernardino Final Score: 44.44 |
| TX | 62.059 | LUB Lubbock Final Score: 83.93 ATX Austin Final Score: 69.763 FRI Frisco Final Score: 68.716 GRL Garland Final Score: 66.967 PLN Plano Final Score: 66.728 DEN Denton Final Score: 66.562 IRV Irving Final Score: 65.6 DAL Dallas Final Score: 64.767 MCK McKinney Final Score: 63.348 SAT San Antonio Final Score: 62.695 FW Fort Worth Final Score: 62.085 GP Grand Prairie Final Score: 59.806 HOU Houston Final Score: 58.491 ARL Arlington Final Score: 58.002 CC Corpus Christi Final Score: 57.52 KIL Killeen Final Score: 54.436 AMA Amarillo Final Score: 51.09 LRD Laredo Final Score: 49.37 BRN Brownsville Final Score: 48.284 ELP El Paso Final Score: 44.294 |
| FL | 85.886 | HWFL Hollywood Final Score: 80.656 PPFL Pembroke Pines Final Score: 77.948 FLL Fort Lauderdale Final Score: 76.989 ORL Orlando Final Score: 75.728 MIA Miami Final Score: 70.141 STP St. Petersburg Final Score: 69.78 HIA Hialeah Final Score: 69.463 JAX Jacksonville Final Score: 69.431 TPA Tampa Final Score: 66.077 CC Cape Coral Final Score: 61.79 PSL Port St. Lucie Final Score: 60.657 TLH Tallahassee Final Score: 52.62 |
| AZ | 46.534 | SDL Scottsdale Final Score: 74.67 TMP Tempe Final Score: 71.012 MES Mesa Final Score: 68.396 GIL Gilbert Final Score: 65.243 CHN Chandler Final Score: 64.654 PHX Phoenix Final Score: 64.51 GLD Glendale Final Score: 64.09 PEO Peoria Final Score: 61.349 TUS Tucson Final Score: 59.78 SUR Surprise Final Score: 56.306 |
| NC | 69.455 | GBO Greensboro Final Score: 73.018 CLT Charlotte Final Score: 70.461 DUR Durham Final Score: 65.66 WS Winston Salem Final Score: 62.725 CAR Cary Final Score: 58.074 RAL Raleigh Final Score: 53.344 FAY Fayetteville Final Score: 47.996 |
| TN | 62.931 | CHA Chattanooga Final Score: 60.408 KNX Knoxville Final Score: 57.258 BNA Nashville Final Score: 54.215 MEM Memphis Final Score: 51.326 MB Murfreesboro Final Score: 49.444 CLK Clarksville Final Score: 47.805 |
| VA | 66.331 | ORF Norfolk Final Score: 70.42 ALX Alexandria Final Score: 68.827 NPN Newport News Final Score: 60.389 RIC Richmond Final Score: 57.905 VB Virginia Beach Final Score: 52.244 CHK Chesapeake Final Score: 49.029 |
| CO | 51.497 | AUR Aurora Final Score: 70.615 DEN Denver Final Score: 68.619 LW Lakewood Final Score: 59.301 COS Colorado Springs Final Score: 50.728 FC Fort Collins Final Score: 48.679 |
| OH | 64.659 | AKR Akron Final Score: 64.911 CMH Columbus Final Score: 61.608 CIN Cincinnati Final Score: 60.348 CLE Cleveland Final Score: 59.033 TOL Toledo Final Score: 51.896 |
| WA | 62.859 | BV Bellevue Final Score: 85.135 SEA Seattle Final Score: 84.341 TAC Tacoma Final Score: 75.273 VAN Vancouver Final Score: 70.521 SPO Spokane Final Score: 59.901 |
| AL | 38.238 | BHM Birmingham Final Score: 67.451 MOB Mobile Final Score: 55.04 HSV Huntsville Final Score: 54.405 MGM Montgomery Final Score: 33.019 |
| GA | 47.386 | ATL Atlanta Final Score: 67.482 MAC Macon Final Score: 55.141 AUG Augusta Final Score: 47.149 CSG Columbus Final Score: 41.946 |
| IL | 66.693 | NAP Naperville Final Score: 67.069 CHI Chicago Final Score: 63.853 AUR Aurora Final Score: 63.252 JOL Joliet Final Score: 58.576 |
| KS | 34.041 | OP Overland Park Final Score: 70.759 KCK Kansas City Final Score: 65.891 ICT Wichita Final Score: 36.596 |
| LA | 51.828 | NOLA New Orleans Final Score: 66.397 SHV Shreveport Final Score: 57.83 BR Baton Rouge Final Score: 54.01 |
| MA | 83.266 | BOS Boston Final Score: 75.755 SPF Springfield Final Score: 71.725 WOR Worcester Final Score: 69.857 |
| MO | 47.459 | STL St. Louis Final Score: 65.601 KCMO Kansas City Final Score: 59.085 SPR Springfield Final Score: 49.178 |
| NJ | 79.928 | PTR Paterson Final Score: 74.088 NWK Newark Final Score: 73.789 JC Jersey City Final Score: 72.428 |
| NV | 35.028 | RNO Reno Final Score: 70.842 LV Las Vegas Final Score: 44.115 HND Henderson Final Score: 39.129 |
| NY | 82.169 | NYC New York Final Score: 85.948 BUF Buffalo Final Score: 84.033 ROC Rochester Final Score: 66.549 |
| OR | 50.083 | PDX Portland Final Score: 65.344 SLM Salem Final Score: 47.159 EUG Eugene Final Score: 42.927 |
| IN | 56.5 | IND Indianapolis Final Score: 57.346 FW Fort Wayne Final Score: 57.161 |
| KY | 35.555 | LOU Louisville Final Score: 63.86 LEX Lexington Final Score: 59.003 |
| MI | 58.121 | GR Grand Rapids Final Score: 66.45 DET Detroit Final Score: 48.931 |
| MN | 58.01 | STP St. Paul Final Score: 76.738 MPLS Minneapolis Final Score: 74.992 |
| NE | 17.89 | OMA Omaha Final Score: 46.868 LNK Lincoln Final Score: 38.855 |
| OK | 18.172 | OKC Oklahoma City Final Score: 46.998 TUL Tulsa Final Score: 41.33 |
| PA | 67.383 | PHL Philadelphia Final Score: 70.256 PIT Pittsburgh Final Score: 60.4 |
| WI | 38.359 | MKE Milwaukee Final Score: 62.207 MSN Madison Final Score: 52.068 |
| AK | 9.845 | ANC Anchorage Final Score: 44.253 |
| AR | 17.955 | LR Little Rock Final Score: 53.968 |
| DC | - | DC Washington Final Score: 74.96 |
| HI | 30.259 | HNL Honolulu Final Score: 39.587 |
| IA | 26.441 | DSM Des Moines Final Score: 49.914 |
| ID | 35.959 | BOI Boise Final Score: 77.972 |
| MD | 65.448 | BAL Baltimore Final Score: 57.248 |
| NM | 23.366 | ABQ Albuquerque Final Score: 54.793 |
| RI | 46.69 | PVD Providence Final Score: 63.124 |
| SC | 51.297 | CHS Charleston Final Score: 65.482 |
| SD | 6.993 | SF Sioux Falls Final Score: 47.25 |
| UT | 53.014 | SLC Salt Lake City Final Score: 76.604 |
Good
Above Average
Below Average
Bad

Data and Methodology
In order to determine the best places for kids and families with food allergies, we sought to have a data-driven approach based specifically on quality-of-life factors that impact the children and families navigating living with food allergies. Our research and rankings are based on 5 key variables:
- Local access to quality grocery stores that stock allergy-friendly options
- Proximity to Emergency Healthcare (Access to Children's Hospitals in case of an emergency)
- Allergy Treatment Options (Access to board-certified allergists that specialize in food allergies)
- Statewide Childcare Policies that specifically address managing food allergies and anaphylaxis in a classroom or childcare setting.
- Environmental factors that affect food allergy or complications with seasonal allergies in general
City Selection Criteria
Our study began with a directory of all 50 U.S. states and over 15,000 U.S. cities. To ensure meaningful comparisons, we focused on ranking 177 cities with populations exceeding 150,000.
We focused on cities with populations over 150,000 to ensure data reliability and fair comparisons. Larger cities tend to have more diverse populations, better infrastructure, and more actionable insights for families managing food allergies.
Data Sources and Key Metrics
We evaluated each city using five primary metrics, chosen for their relevance to food allergy management:

Allergy-Friendly Grocery Stores
- We sought out some of the most well-known allergy-friendly food supply brands and got access to their store locators to determine more than 6,000 high-quality grocery stores across the U.S. where their product is sold.
- We then cross-referenced this information with the geolocation of a city to find the number of grocery stores offering allergy-friendly products within a 10-mile radius of the city center.
- Per Capita Metric: Grocery stores per 10,000 residents, adjusted to reflect population differences.

Proximity to Emergency Healthcare (Children's Hospital)
- Food-allergy-related emergencies involving children (anaphylaxis or hypovolemic shock) can quickly become life-threatening and pediatric hospitals are uniquely equipped to handle these critical situations with expertise tailored to young patients. This is why proximity to Children's Hospital was chosen as a metric to assess access to emergency care.
- We used Logarithmic distance for the final calculations to eliminate outliers.
Source: Children's Hospital Association

Allergy Treatment (Oral Immunotherapy Specialist)
- Since Oral Immunotherapy (OIT) is one of the leading treatment options for food allergies, we identified board-certified OIT allergists nationwide to find allergists that specialize in food allergies in particular.
- We used Logarithmic distance for the final calculations to eliminate outliers.
Source: Food Allergy Support Team

Statewide Childcare Policies
- A score out of 9 evaluating state-level policies that address food allergies and anaphylactic procedures in childcare and school settings.
Source: Elijah's Law Report for U.S. States and Territories by AAFA

Hybrid Allergy City Score
- A composite metric combining proximity to cities ranked as “Good” and “Bad” Allergy Capitals by the AAFA (Asthma and Allergy Foundation of America).
- Cities closer to “Good” Allergy Capitals and farther from “Bad” Allergy Capitals scored higher.
- The AAFA study focuses on asthma and seasonal allergies rather than food allergies. However, we included this data in our food allergy study because many children with food allergies either already experience or are more likely to develop asthma or seasonal allergies in the future.
Source: AAFA Allergy Capitals report
For the state ranking section, our methods differed slightly.
For the first metric, we used the total land area of a state and compared the total number of Allergy-Friendly Grocery Stores within the boundaries of a state. We calculated the density of Grocery Stores Per 100 square miles for each state
A count-based approach was chosen for metrics 2 and 3 (Proximity to Emergency Healthcare and Allergy Treatment Options). We looked at how many pediatric hospitals and OIT specialists were located within the boundaries of a state. Then, the density per 100 square miles was used for both metrics.
Since metric 4 (Statewide Childcare Policies) is already a statewide perspective, this did not need to be reconsidered.
Finally, we introduced a new fifth metric instead of the Hybrid Allergy City Score. To account for statewide environmental factors, we used Statewide Pollen Count (PPM) as the final statewide metric, as found in Wyndly's 2023 Pollen Allergy Report.
Scoring and Weighting
To create fair and meaningful rankings, we assigned weighted scores to each metric, normalizing all data on a 0–100 scale. Higher scores indicate better support for families managing food allergies.
Each category was assigned a weight based on its importance to families managing food allergies. Greater weight was given to healthcare access, particularly the distance to Oral Immunotherapy (OIT) specialists (34.48%), as access to specialized care is one of the most critical factors in managing food allergies. The final weights were distributed as follows:"
| Category | Weight | Percentage of Total Weight |
|---|---|---|
| Allergy-friendly Grocery Options | 10 | 17.24% |
| Proximity to Certified Oral Immunotherapy Specialists | 20 | 34.48% |
| Proximity to Children's Hospitals | 10 | 17.24% |
| Statewide Anaphylaxis Childcare Policy Rating | 10 | 17.24% |
| Environmental Factors (Hybrid Allergy City Score or Statewide Pollen Count) | 8 | 13.79% |
| Total | 58 | 100% |
Logarithmic transformations were applied to healthcare proximity metrics to minimize the impact of outliers, ensuring cities with extreme distances did not disproportionately affect rankings.
Final Ranking Calculation
Each city's Final Score was determined by combining its weighted scores across all five metrics. Based on their Final Scores, cities were classified into four descriptive rating categories: Good, Above Average, Below Average, and Bad.
Limitations
While our study aims to provide actionable insights, there are a few limitations to consider:
- Cities with smaller populations (<150,000) were excluded, potentially overlooking exceptional smaller communities.
- Grocery store and healthcare proximity metrics assume the city center as the reference point, which may not reflect the experience of all residents.
GGM Ratings for Allergy-Friendly Cities and States: Understanding the Metrics
The adjective ratings provide a straightforward way to understand how cities and states performed in terms of allergy-friendliness. These descriptors—Good, Above Average, Below Average, and Bad—were assigned based on overall performance across our ranking factors. Here's what each rating signifies:
- Good: Cities that stand out with exceptional resources and infrastructure to support families managing food allergies. These cities performed significantly above average across most categories.
- Above Average: Cities that exceed the average in key areas but may lack the comprehensive support seen in "Good" cities.
- Below Average: Cities with noticeable gaps in allergy-friendly resources compared to the average, making allergy management more challenging.
- Bad: Cities that fall short across most categories, failing to offer key support for managing food allergies.
Questions about our study? Contact us at questions@greatguysmoving.email

